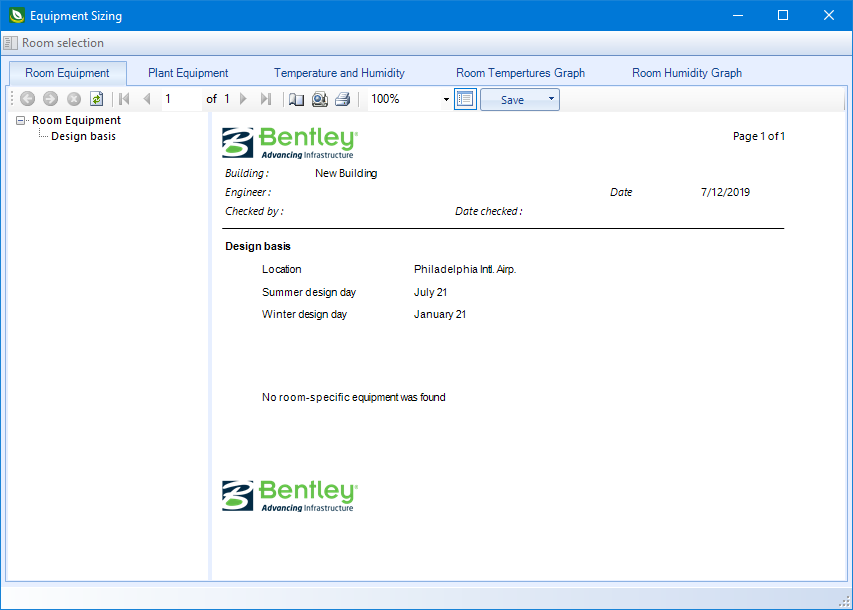
| Room Equipment
|
Lists the equipment in each room that contribute in simulation
calculations.
|
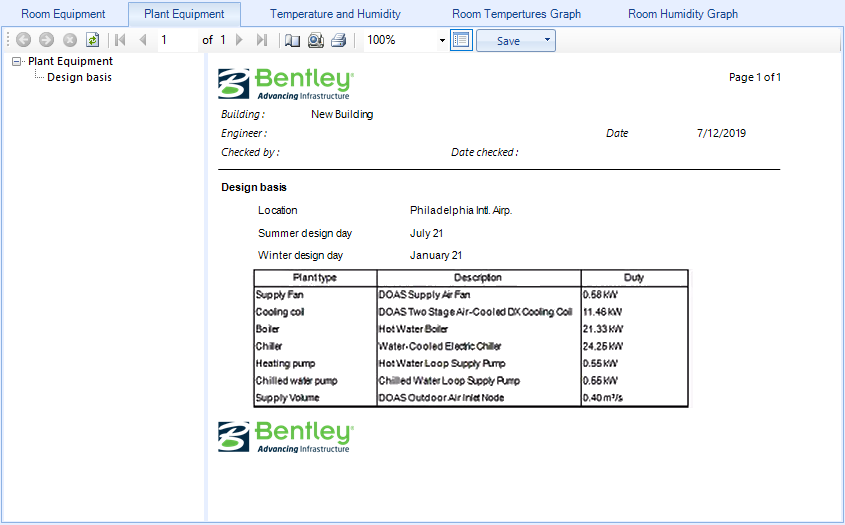
| Plant Equipment
|
Lists the equipment in all types of plants in the current project
that are taken in simulation calculations. The duty values for each plant is
also computed.
|
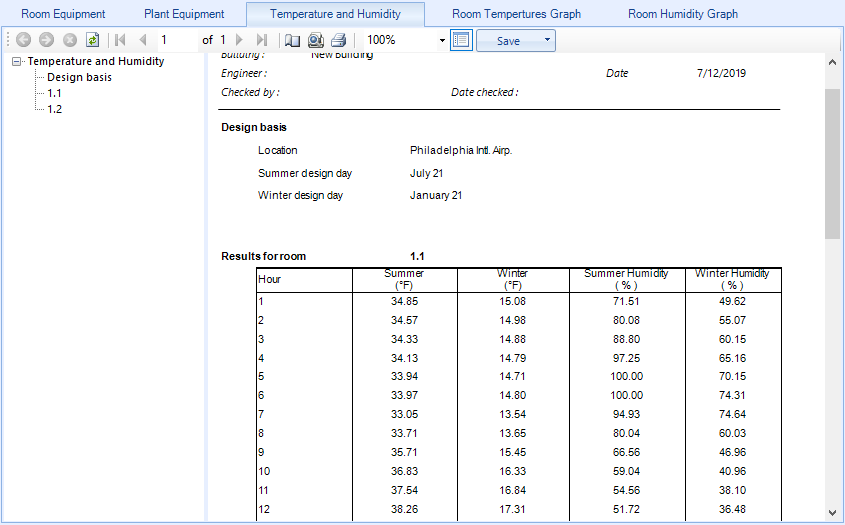
| Temperature and Humidity
|
Lists the hourly temperature and humidity values in both summer
and winter days.
|
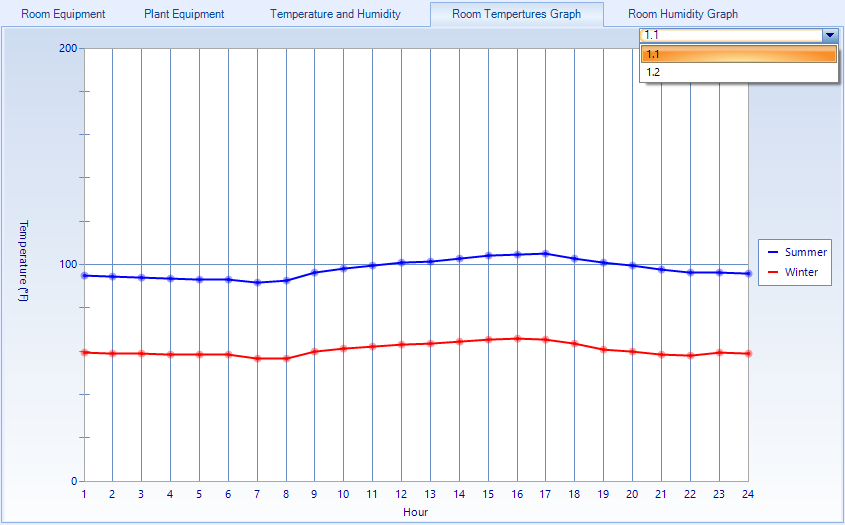
| Room Temperatures Graph
|
Contains controls used to view a graphical report of the
simulation room temperatures result. Select a room from the list to update the
graph.
The temperature graph for selected room can be displayed. The
pattern of the temperature for every hours of a day is shown as a colored
curve.
- Temperature - The
temperature values are displayed on the graph's vertical (Y) axis. The scale is
automatically adjusted when viewing smaller or larger values making it easier
to distinguish the separate graph curves.
- Hour- The 24 hours
time of the design day are displayed on the graph's horizontal (X) axis.
- Curve - Room
temperature distribution patten for the selected room for summer and winter
days are displayed with color coded curves. The color codes are described in
the graph legend. The curves and legend are interactive, providing you with pop
up help windows.
|
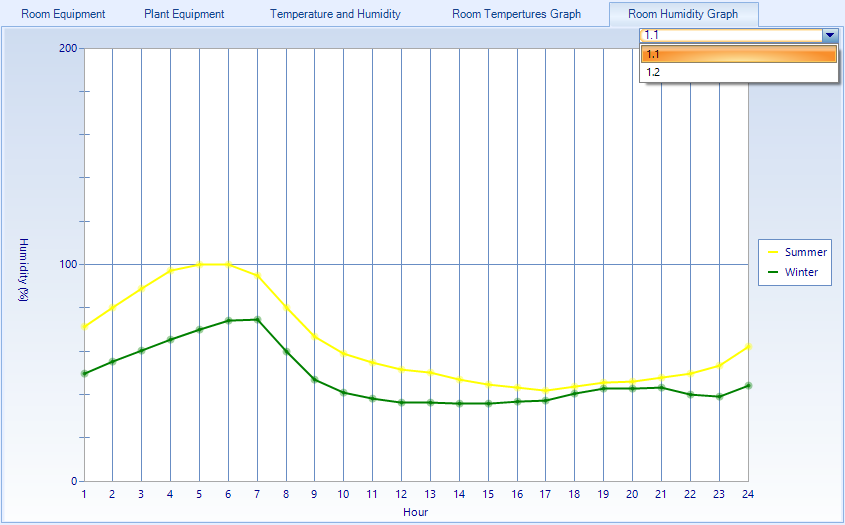
| Room Humidity Graph
|
Contains controls used to view a graphical report of the
simulation room humidity result. Select a room from the list to update the
graph.
The humidity graph for selected room can be displayed. The
pattern of the humidity for every hours of a day is shown as a colored curve.
- Humidity - The
humidity values are displayed on the graph's vertical (Y) axis. The scale is
automatically adjusted when viewing smaller or larger values making it easier
to distinguish the separate graph curves.
- Hour- The 24 hours
time of the design day are displayed on the graph's horizontal (X) axis.
- Curve - Room
humidity distribution patten for the selected room for summer and winter days
are displayed with color coded curves. The color codes are described in the
graph legend. The curves and legend are interactive, providing you with pop up
help windows.
|